Assess and prioritise
What does impact look like for your project and city?

On the ground
Defining goals and measuring impact
Can you refine your vision and definition of success?
Clarifying the narrative around what you want to achieve can not only help your team stay aligned as implementation progresses, it can also serve as a backbone for public communications and for gathering buy-in.
Where in your city can you have the greatest impact on the well-being of families with young children?
The data you gathered while scanning and researching the context can help you prioritise locations to focus on. How can existing infrastructure, resources and investment already allocated to the neighbourhood be leveraged? Also consider opportunities for quick-win interventions. Quick wins are small interventions that require few resources but have visible positive impact in the short term. They help show what’s possible and gather support for deeper, more resource-intensive interventions.

Tools & resources
What objectives and impact indicators are appropriate
The very process of developing project objectives and indicators can provide a useful way to substantively engage stakeholders and the community at the start of the process. For example, objectives might mirror clear needs for different services and activities that the community has already identified. Consider which impact indicators – qualitative and quantitative – could be used in the short term (for monitoring) and over the long term to demonstrate overall impact.
Anchoring a focus on the early years in national urban policies

Tools & resources
Consider both progress and impact
We have defined impact indicators to focus on changes in caregiver well-being and caregiving behaviours resulting from our interventions. But tracking implementation’s progress can require a different set of metrics. For example, our partners have found it useful to track progress by measuring outputs such as the number of changes completed in the built environment, the number of caregivers reached, or investment spent.
Is it possible to link data systems from various government departments to track progress across sectors?
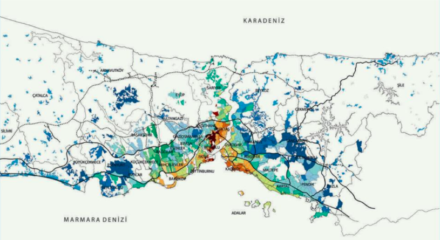
Visualising diverse data in one place can help with prioritising interventions and tracking progress. It also allows for different agencies to better coordinate their activity in favour of babies, toddlers and their caregivers for better results. It can also help communicate progress externally and internally, giving feedback to frontline workers and reinforcing their sense of project ownership.
Integrated early years data infrastructure

Systems-level support
Leverage overlapping agendas
Where and how do your priorities overlap with those of local communities?
Consider integrating those areas of overlap into your choice of indicators, so that your data and results strengthen local ownership of the intervention. Ownership increases the sustainability of the intervention by maintaining demand from communities over time. Community ownership can also help anchor new behaviours within the beneficiary group.
Where and how do your priorities overlap with those of other organisations and leaders?
To sensitise leaders with overlapping agendas, think of stories and data that could contribute to those too. For example, some early childhood intervention can help reducing gender inequality or increasing climate resilience. Joining forces may even increase the amount of funding available for the project.